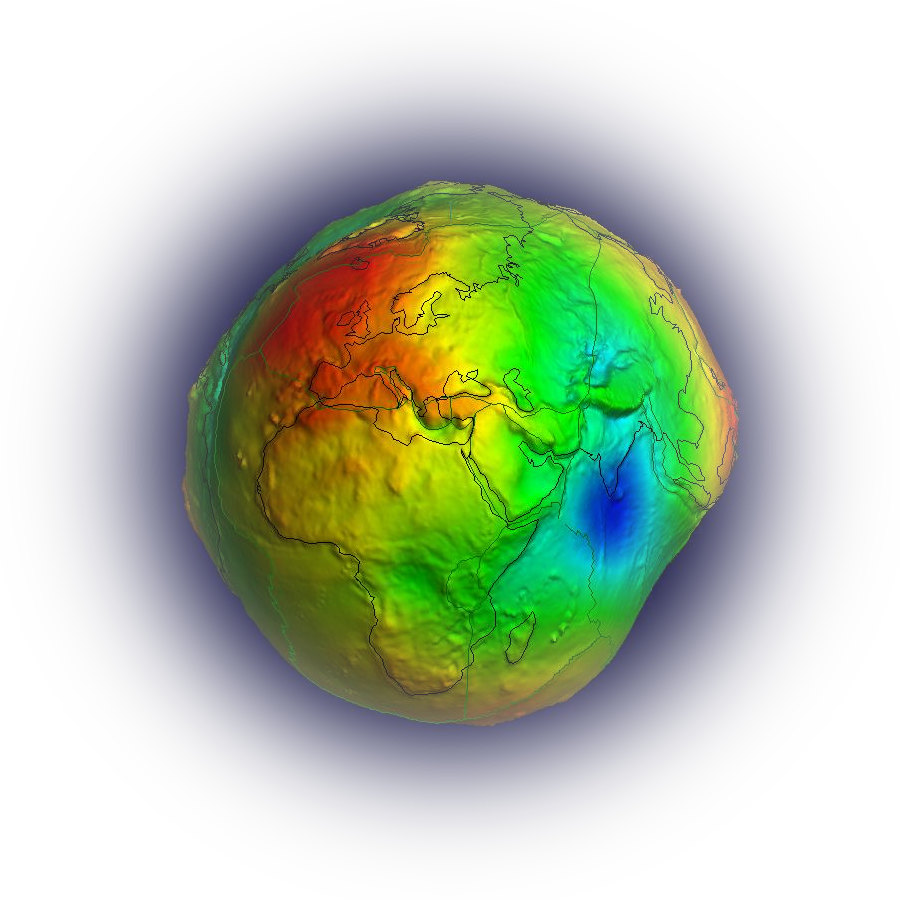
Visualization of Gravity Field Models and their Differences

This is an interactive web site (based on Javascript) to visualize the Geoid and other gravity functionals of the Earth. Please have some seconds patience for generating the image on the server.
The Geoid undulations are multiplied with a so-called radial 'boost factor' (initial value: b = 10,000) to make them visible.
You can select another Functional, gravity Model and Subtrahend model (to display model differences).
The option Grid defines the resolution of the view: smaller values show more details, but require more computing time (on the server).

Functional Model Subtrahend Grid [°] lmin lmax
plates/lines   Boost   Color   Background  
By clicking on the image you can Rotate and by scrolling with the mouse wheel over the image you can Zoom.

Privacy Settings

We use cookies that are necessary for the basic functionality of our website so that it can be continuously optimized for you and its user-friendliness improved. We also use the Matomo web analysis tool, which tracks data anonymously. This enables us to statistically evaluate the use of our website. Your consent to the use of Matomo can be revoked at any time via the privacy policy.